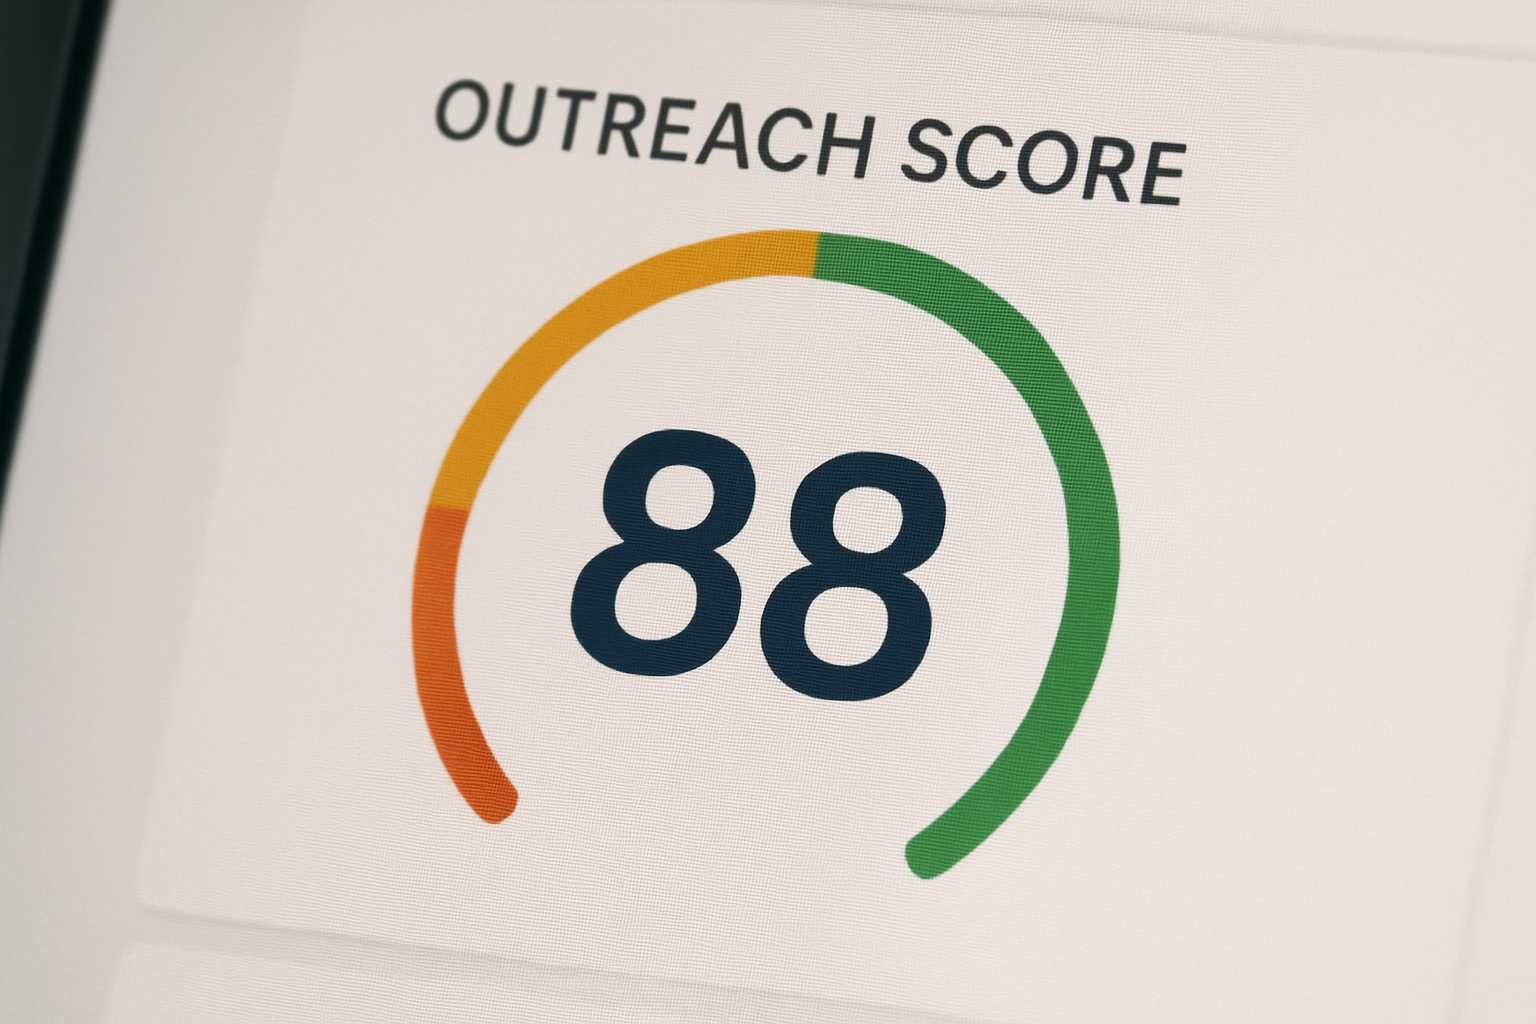
As special districts, we know the importance of reaching out to our communities to share our expert information, and to ensure our behind-the-scenes work doesn't go unnoticed. Which is why we have launched the Special District Outreach Score!
This is a measure of how effectively special districts across the country are engaging with their communities. After all, the first step to get better at something is to measure where you're at! This year districts scored a 43 out of 100. The score is the average calculated across special districts that have a website.

The score takes into account factors including having a public website (of course!), as well as active social media presence, active newsletter (or blog or news feed), links to the district websites from other websites (each link is essentially a vote for a website), and the number of visitors to the districts' sites. Taken together, these factors provide a good picture of how well special districts are sharing quality information and promoting their important work.
For individual districts, the Outreach Score can be a good way to benchmark your progress as you ramp up your outreach efforts. If you would like us to run your score for your district, just click the button below. We will email you your score along with a summary of why you received your specific score.
Some interesting facts from the analysis:
This score will help monitor the progress of special district outreach over time. We will revisit the score each year and hopefully report back an incrementally higher score next year!
Thank you for joining us in this latest edition of the State of Special Districts 2022. Please take a moment to explore our previous editions.
PREVIOUS EDITIONS
